| Trinity T3 Features |
| HOME | PRODUCTS | SUPPORT | UTILS | LINKS | ABOUT |
| | Home... | S. Africa exmple... | Qatar exmple... | 3D Movie | About T3 | |
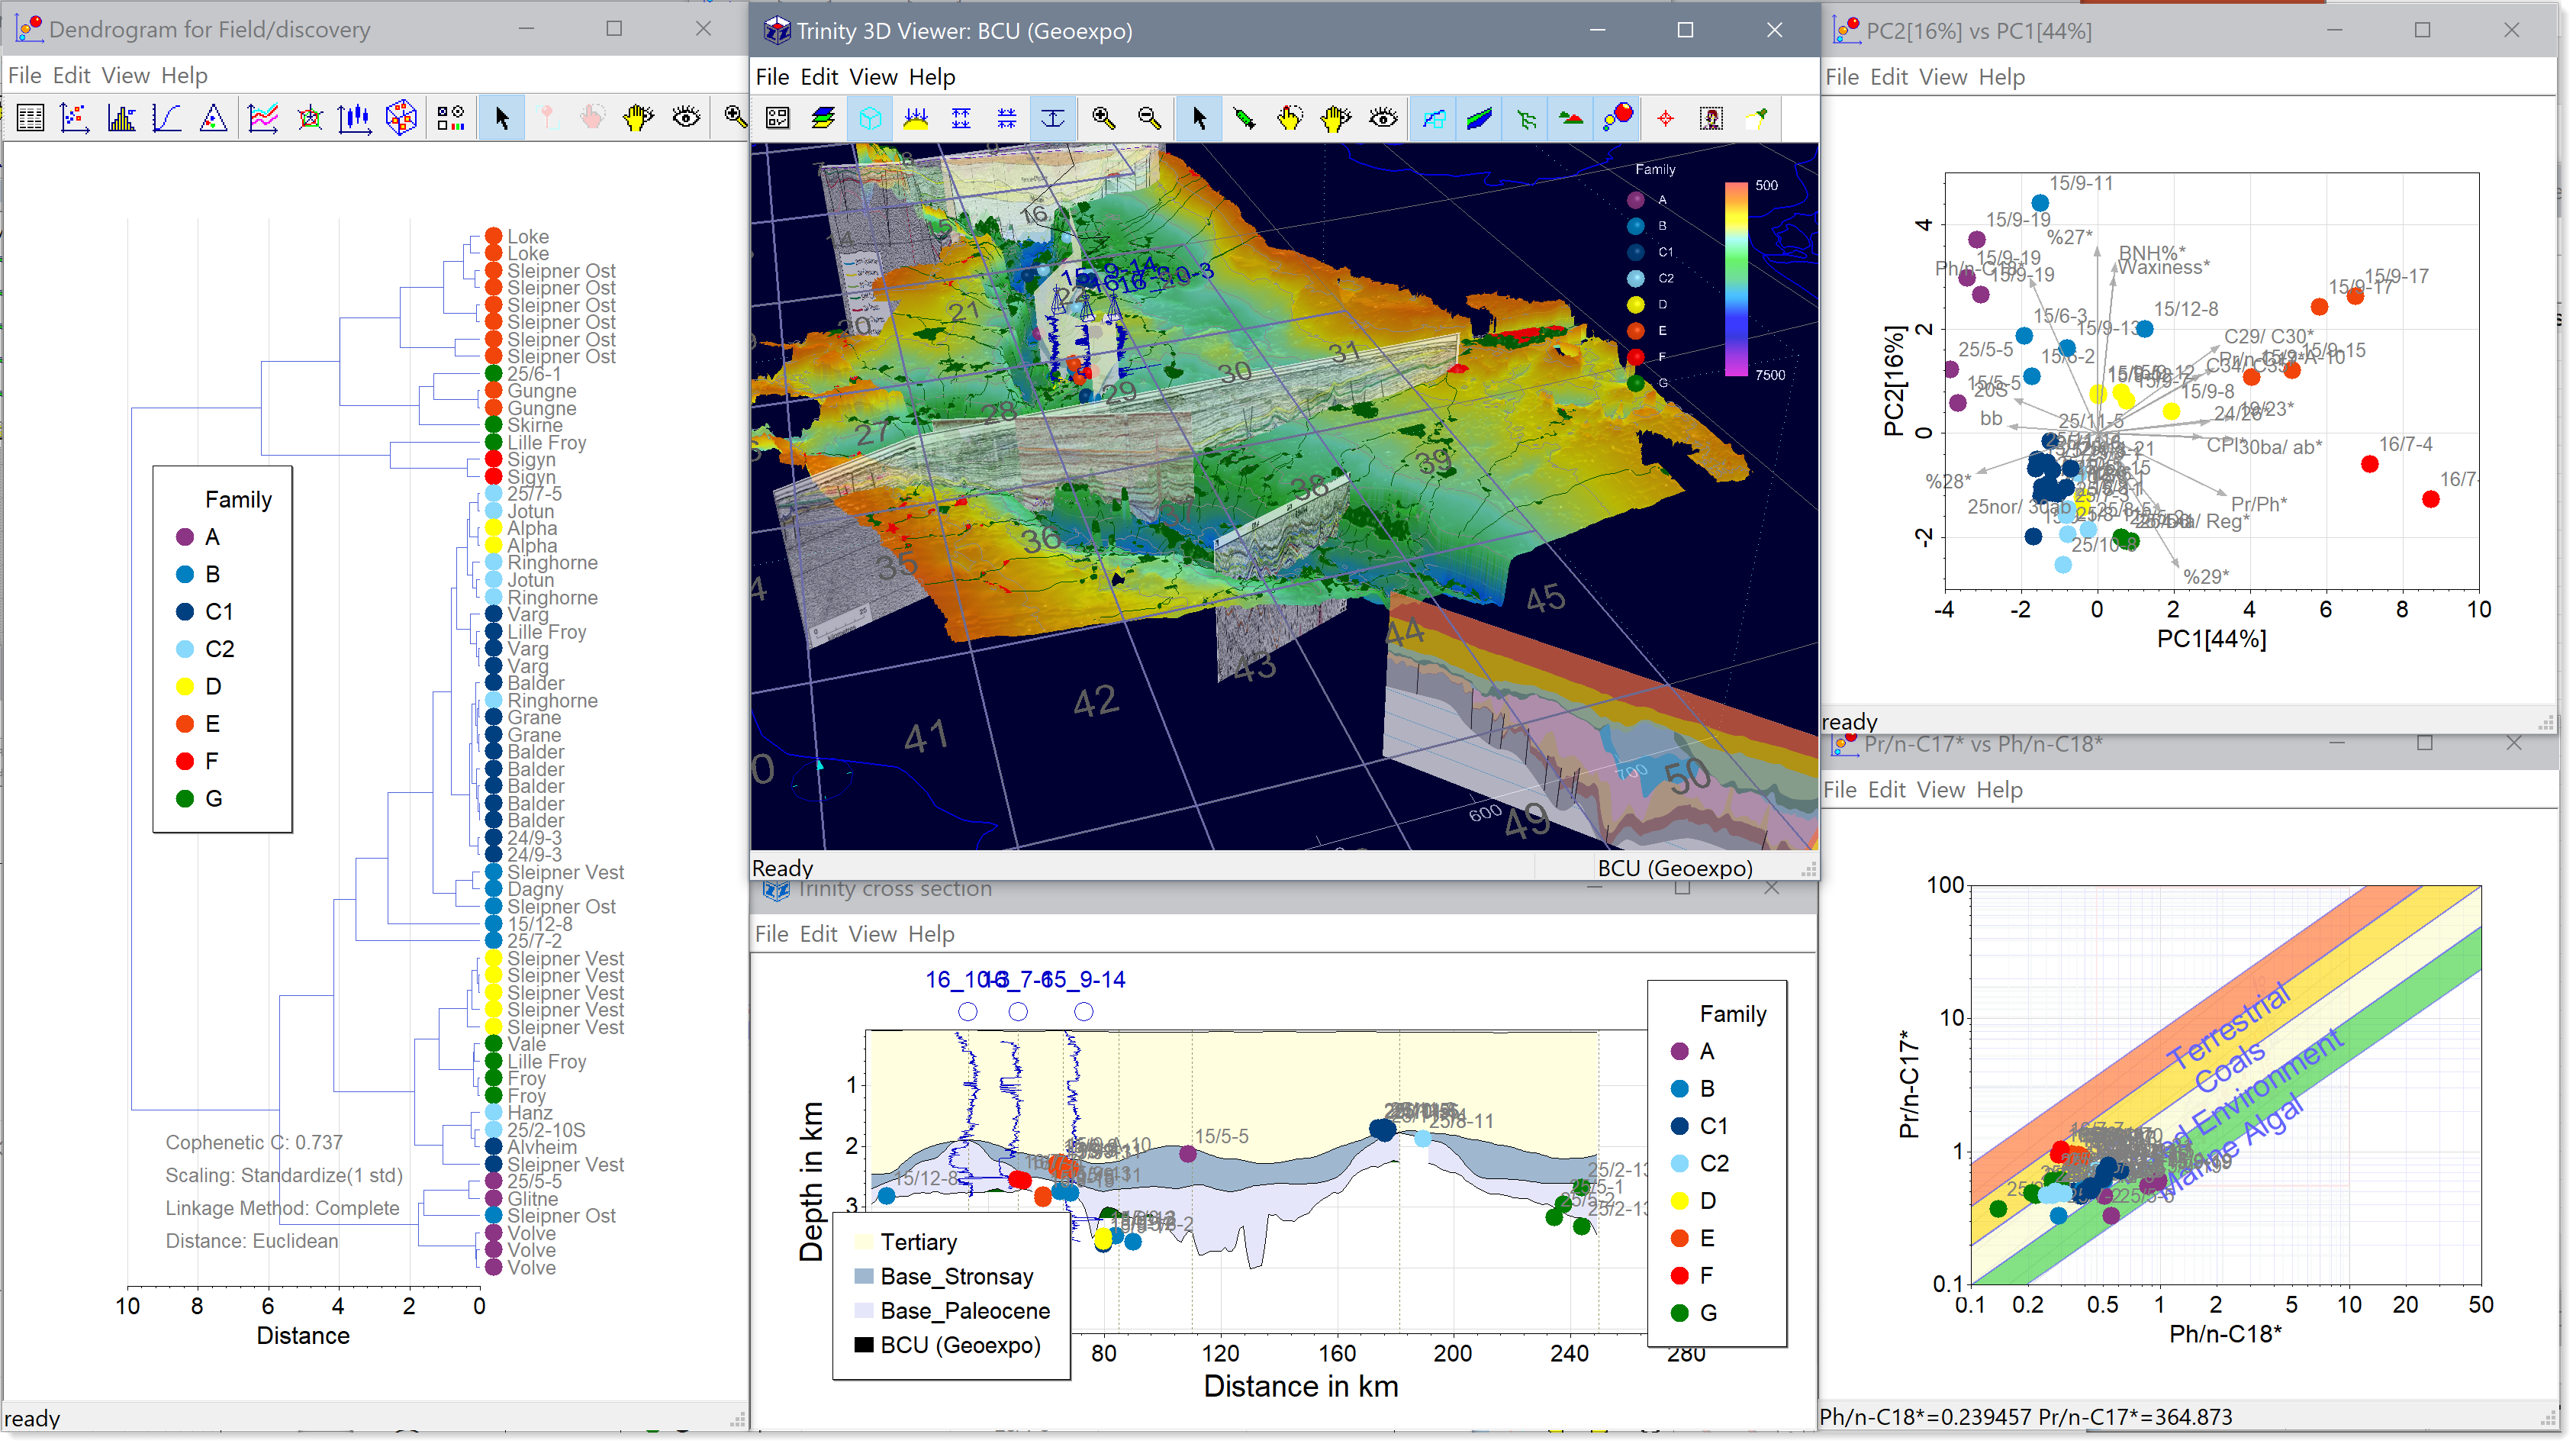
The HotSpot tool in Trinity 3D is the only geo-spatial data analysis tool in the industry. No matter the amount of data, type of data, you can take shape files, spreadsheets, data-bases, LAS files, seismic attributes, geophysical, geochemica, .. and put them all together with your geolocial model (map surfaces, faults, images, seismic cross sections) to interact and anlylize, to spot trends, correlations, relationship with geological elements, live in 2D and 3D, and much more.
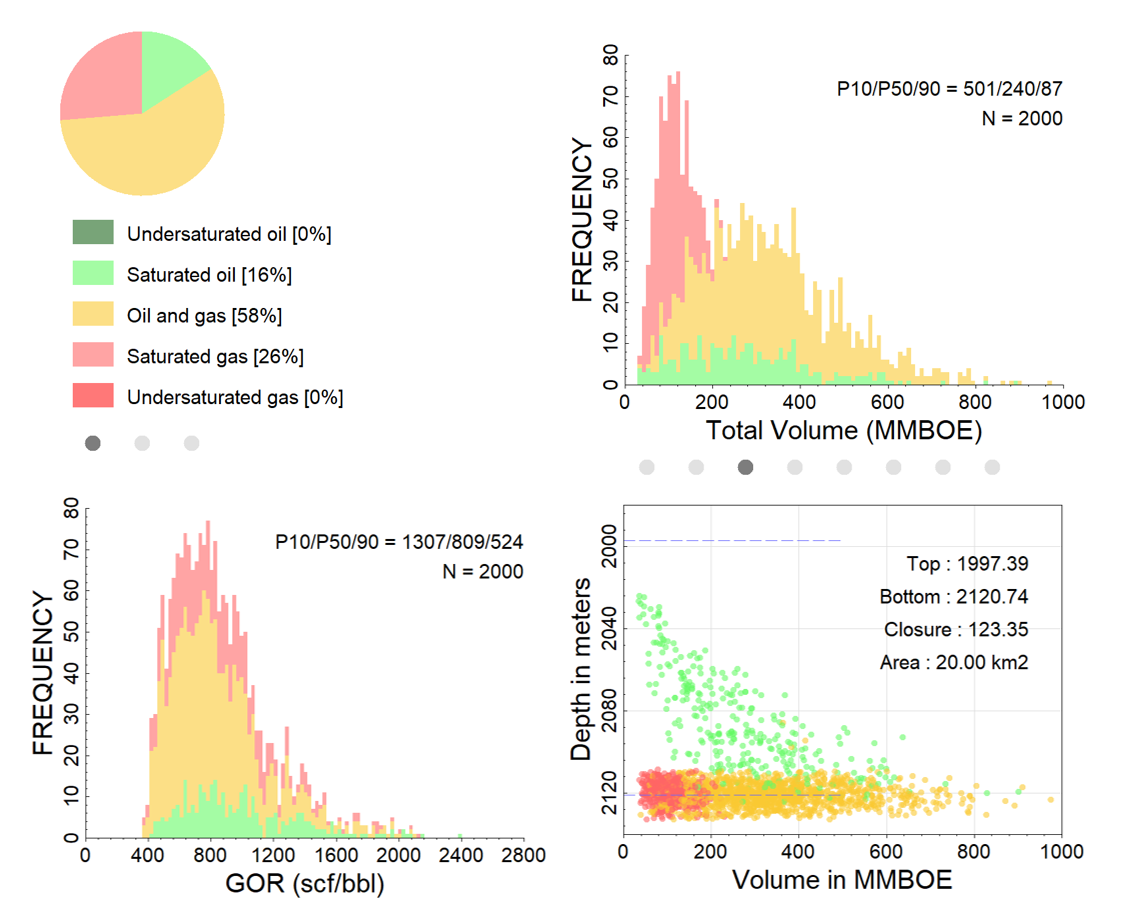
New in 2020. The fluid contained in a trap is not only dependent on the charge, but also the PT conditions at the trap, and the seal capacity vs the trap size (Sales 1997). The uncertainties in the charge volumes and fluid properties, the phase behavior of the fluids, and the seal capacity are combined in a Monte Carlo tool to predict the end results of what may be in the trap, how much and the properties of the fluids. It also gives column heights distribution and the relationship between fluid type, column, and reserves possible.
T3 has many additional features on top of the standard Trinity version. The largest leap in T3 is to allow tracking of hydrocarbon fluid volumes and properties while they migration in 3D space. Interactive 3D migration allows petroleum system analysist to de-risk migration scenarios for proepects.The following figure shows the ability of T3 to model various geological scenarios where migration occurs vertically. See this example
Follow this link to see some examples.
Temperature And Allocthonous Salt
Another important feature of T3 is its ability to correct for the conductivity effects of allocthonous salt through time. This feature improves the ability to model sub salt source rock thermal history and maturation. The figure below shows a temperature profile at a well location in T3, where the Trinity temperature (blue line) agrees with temperature data and Temis3D model results.
Interactive Biodegradation Tool
T3 includes an interactive fluid property/ biodegradation risking tool. The instantaneous fluid properties are calculated as a function of source facies and maturity in the fetch area. The fluids are mixed in the reservoir with existing fluids from earlier charge that may be biodegraded. The biodegradation model, considers trap OWC area, column height, nutrient supply, temperature and residence time. User can interactively investigate the possibility of biodegradation and provide best estimate of API gravity for a prospect. Migration losses and migration delay time also will affect the property of the charging oil.
In the figure above, the arrows indicate the time when oil charge begins and time when a competent seal is formed. The arriving oil at present day is 40 API but as 60 percent of the cumulative oil has been biodegraded, the oil in the reservoir now stands at 20 API.
If the reservoir temperatuers are high and biodegradation is not a risk. This tool can be used to look at instantaneous and cumulative fluid API of the oil charge and trap timing effects on oil API.
Shale Gas and Coal Bed Methane Tools
T3 models the burial and thermal history to predict sorption gas, solution and free gas yields (scf/ton or scf/section) over the area. All three phases of gas are pvt and mass balanced through the burial and uplift history of the basin to enable regional evaluation and predict sweet spots. The model is calibrated with well data from a significant shale gas domain. Highly interactive and allows scenario testing with different thermal regime and erosion amounts.
The shale gas tool makes CBM Methane yield maps as function of maturity, thickness, TOC and pressure, temperature. Built-in empirical permeability model. Produces gas yield, permeability maps for sweet spot mapping.
T3 allows thickness change to be applied to multiple layers and multiple events. This allows burial history of various complex geological situations to be modeled correctly. These include thrusting which thickens formations due to duplication and folding as well as normal faulting which thins formation locally (see figure below).In these cases, layers may be deposited with a certain thickness, but post depositional structure movement causes the thickness to change. T3 provides tools for the change of thickness to be estimated as well.
- Cross strata 3D migration. User can interactively inject volumes to investigate 3D migration plumbing system or run 3D spider maps to scenario test multiple carrier migration models to compare with known accumulations and dry holes. It does this with PVT and completely interactivity (it takes only few seconds!);
- The ability to use a laterally variable top seal map at each carrier level to allow salt welds, faults, as well as effective stress weak points (over pressure) to be used for vertical migration;
- Sub cropping, unconformity truncation can be used to automatically allow vertical leakage. 3D fault planes/surfaces to be used in diverting migration between structure surfaces;
- Allows facies maps to be associated with each carrier to look at migrating and charge via stacked channels, pinch outs, etc. Predicting pay /non-pay at different levels.
- Allows potentiometric surfaces to be defined at each horizon so hydrodynamic or over pressure effects can be modeled independently for each formation.
- Remigration: allows migration modeling through time by re-migrating existing accumulations and adding newly expelled volumes
- 3D structure movie with maturity maps draped paleo-structure map, evolving through time in 3D viewer.
- Automatically deflect temperature profile through salt to correct salt thickness effect based on an empirical model. Workflow to handle 3D salt effects.
- Multiple/unlimited thickness change models. This is used to model multiple phase salt thickness change through time or simulating effects of thrust duplication. Multiple thickness change maps can be associated with one interval to vary thickness in multiple episodes, and multiple layers can be associated with thickness change through time. Regular Trinity is limited to one layer and one event.
- Migration movie - continuous migration on a structure surface through time. This is a planned feature not available yet technically not hard to do as we can already do it manually stepwise.
- Multiple source rock input for charge history.
- Phase risking tool.
Copyright ©2001-2004, ZetaWare, Inc. All rights reserved