| Feature list | Qatar exmaple | Other exmaples | 3D Movie | About T3 | South Africa Example:
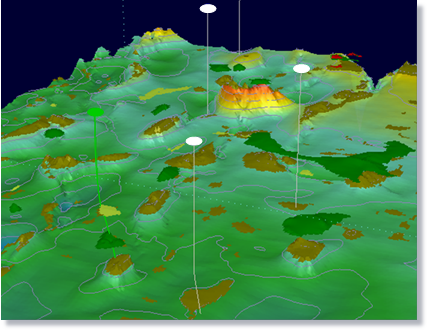
In this example the model is used to explain the discovery well (green curve) and the numerous dry holes (white curves) in the area. The Miocene accumulations (dark green) are only present in a limited locations. The conclusion is that the top seal capacity at the Oligocene level dictates the number of Miocene prospects that have access to charge from below. The model is then used to rank prospects based on access to charge.
This approach that matches existing fields, dry holes with the simple geological model allows calibration of the migration model to the local geology and the power to rrank prospects and predict other possible accumulations.
 Copyright ©2004, ZetaWare, Inc. All rights reserved. |