| ZetaWare Kinex Customer Support |

|
| HOME | PRODUCTS | SUPPORT | UTILS | LINKS | ABOUT |
| Basic Concepts | Simple Tutorial | Shale Play Example | Reservoir cracking | FAQ | What Is New? |
 Introduction
Kinex is an extremely easy to use source rock modeling tool. You simply drag and drop one of the source rock organo-facies in the mix table below and click Calculate. By default it will plot relative fractions of oil and gas expelled as a function of temperature, assuming a simple linear heating rate which you can adjust easily. You may double click the plot and then charge the variables to plot other parameters. These include volumes of oil and gas and their fluid properties, and many others - for the source rock. If you have some Rock Eval data, you may adjust the input TOC, HI etc. and see how they impact volumes and GOR of expelled fluids. You may check out this page for the basic theory, definitions and the assumptions . Kinex is designed for the exploration geoscientist to get quick answers to the most important questions about the petroleum system the source rock (type, maturity, fluid type, and volumes), and test scenarios in a matter of minutes. Most basin modeling software is so complex that it becomes impossible for the users to understand why we are getting a particular answer about something, and since each model may take weeks to build, and hours to run, there is no time to investigate what is the most important controls are.
The default five organo-facies available in Kinex are based on the now classic Pepper and Corvi (1995) papers which linked the major source rock forming environments, source rock properties, and related fluid types. They serve as excellent predictive tools especially in new venture exploration where source rock information is scarce or nonexistent. They may be fine tuned or calibrated in areas with lots of source rock data, such as some of the North America basins. Below are some typical applications using Kinex.
Learning the Behavior of Source Kinetic Models
Kinex is very useful for the geologist to learn the behavior of source rock kinetic models and their implication in exploration. Kinetics refers to the temperature and time dependency of the kerogen to hydrocarbon reactions. Due to the non-linear mathematics involved, it is not an easy concept to grasp for a typical geoscientist. This is where Kinex helps. Kinex can perform the math calculations super fast, so you can simply click and learn. By trying different organo-facies, and changing the basic source rock parameters, such as TOC, Hydrogen Index, etc, Kinex allows the geologist to learn how each of the source rock facies and the parameters affect the hydrocarbon volumes and fluid type. By changing the heating rate, the user learns what temperature is required for the source rock to mature. Once the learning translates into the intuition of the geoscientist, he or she can make quick judgement or predictions by just looking at the basic data of a basin, and also to know if a more complex basin model is producing reasonable answers. Here are some of the basic things you may learn by playing with the parameters:
- Higher original HI of the source rock will give not only more expelled volumes, it will increase oil expulsion compared to gas, producing lower GOR oils for marine and lacustrine source rocks. More oil will also be expelled from deltaic fluvial source rocks (D/E) vs gas.
- Increasing heating rate (rapid burial rate) will increase the temperature required to generate and expel oil, meaning the oil window will be deeper. Roughly speaking, increase the heating rate by 1 order of magnitude will delay the on set of generate by about 15 °C or 500 meters deeper in a basin with 30 °C/km geothermal gradient.
- 30 meters of good oil prone (HI=300mg/g, TOC=60%) coal can expel more HC volumes than a 100 meter of very good marine (HI=600, TOC=5) source rock.
Quick Fluid Type Predictions
When we are looking at a new area, say in a data room. We learn about the depositional environment of the potential source rock, and the maximum temperature of the source rock based on burial depth and the geothermal gradient. Based on that, we can drop in the appropriate organo-facies, and calculate the fluid types we expect. If the basin has undergone very fast deposition, we can increase the heating rate and see whether that may cause maturity concerns if the source rock is not hot enough. If some representative source rock data is available from wells or outcrop, you can enter them in Kinex and get a general idea of what fluid type ( oil vs gas, GOR/CGR ranges) and volumes are expected.
Estimate Ultimate Expulsion Potential (UEP)
Simply put in the basic source rock parameters (original values when it is immature), you can quickly calculate the total volume of hydrocarbons each source rock interval would ultimately expel. The UEP plot shows the total volume in mmboe/km2, and if you multiple the area involved, you can get an idea the maximum resource potential of the area. Below is a Kinex plot of some typical source rocks, with representative quality and thickness. You can see that a 30 meter layer of oil prone coal, typically found in many Southeast Asia basins, would privide much more total petroleum volumes than their much thicker counter parts in the same region.
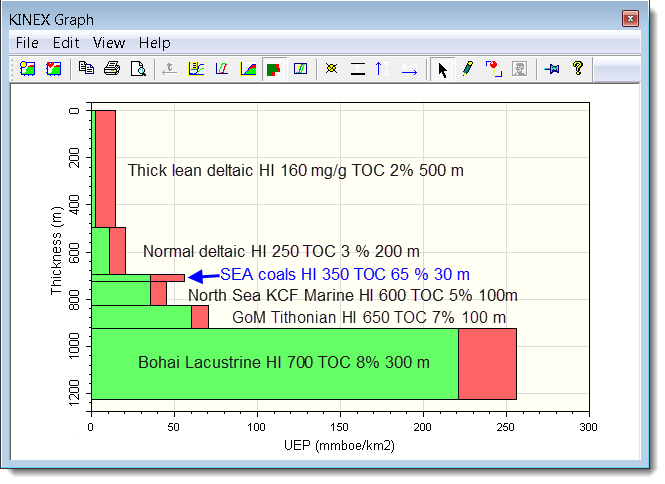
You may also note that the marine and lacustrine source rocks (A,B and C) actually expel much more gas than the normal deltaic (D/E and F) source rocks but because they generate so much oil that all the gas would mostly exist in associated (dissolved) gas in the oil accumulations.
Where does your source rock stand ?
Understand Source Rock Heterogeneity
No source rock is homogeneous or uniform, typically over the larger source rock interval the organo-facies type and the properties (TOC, HI) would change significantly. Kinex allows you to assign each source interval with different organo facies (kinetics), and properties (TOC, HI and thickness etc). It allows you to see the relative contributions of oil and gas of the different source intervals, which can be greatly different. As you may learn that very often the thin organically rich interval in a marine source rock sequence accounts for the bulk of the volumes expelled, especially for oil. In some Southeast Asia Tertiary basins, a 30 meter coal could contribute 20 times more volume than 100 meters of ordinary deltaic "source rock". This relationship may not be recognized if you just look at the data itself via conventional classification. Each interval may produce different fluid type depending on the facies and properties, and they may expel at different temperatures. It is very difficult to come up with an average source rock that can represent the behavior of the gross source rock interval. By simple averaging, it will give different results, usually much less potential and less liquid product (oil).
Evaluate Reservoir Gas Cracking Risk
The In Reservoir Cracking option in Kinex lets you estimate the temperature range reservoired oil would crack to gas, and degree of cracking based on the maximum temperature and estimated heating rate for your potential reservoir.
Using Kinex with Genesis
Kinex is normally limited to simple heating rate thermal models. Genesis is a bit limited in the source rock maturation model. It does not provide as many options for the expulsion model and maturation parameters as Kinex, or easily handle vertically variable multiple source rock layers. You can get the best of both by loading thermal history of the source rock modeled by Genesis into Kinex. You can build the source rock details in Kinex. And simply load the Genesis calculated temperature history for that source rock. You can then plot the results in Kinex. For example:
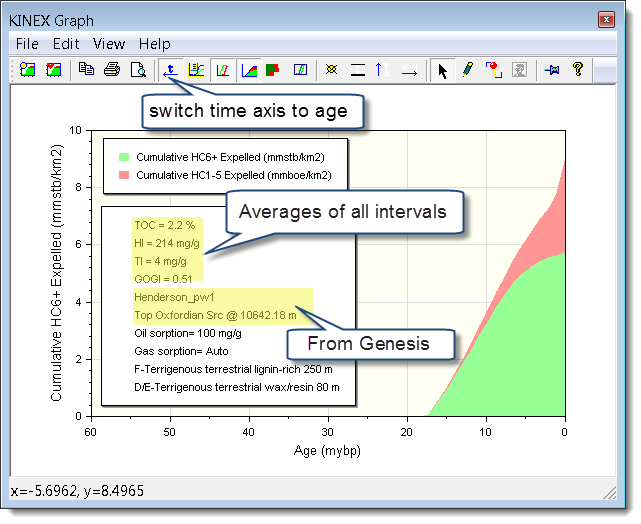
This figure shows the expelled volumes of oil and gas in mmboe for a source rock model with 250 m of F facies and 80 meter of D/E, for the source rock Top Oxfordian at 10642 meters in the Genesis model. The temperature history for the source rock is modeled by Genesis. The steps are.
- Build and run Genesis as usual, without describing the source rock
- Build the source rock facies model in Kinex, adjusting to your favorite expulsion parameters etc.
- Choose File/Import Genesis thermal History, and select the Genesis model file
- Select the source rock formation in Genesis in the list that comes up. This will load the temperature history.
- Make a plot of your favorite parameters using Time as the X axis.
- By default Time zero in Kinex is beginning of model, so you need to switch to Age by clicking the Time as age button. Rename the X axis title if you like.
- Turn on the detailed Legend to show more information if desired as shown above.
Calibrate Source Rock Model from Fluids
Very often we may have information of the fluid type and properties (IHS data, or published reports) from fields in the area we are working, but have little or source rock data. Often the source rock data may not be representative of the source rock facies in the kitchen. We can test if the expected source rock type is reasonable - ie. does it provide the fluid types observed. If the discovered fluids are of higher GORs, perhaps the source rock HI can be lowered to account for that. If the oil discovered is low API, low GOR and higher sulfur, we may determine that the source rock may be an excellent carbonate type (organo-facies A), although we may not have drilled the source rock in the area. Our belief is that this type of calibration is more useful than simply taking the source rock data available at its face value. Depositional environment vary laterally and typically our wells are drill on structure highs, and looking for reservoir rocks. These are not usually where good source rocks are formed. The calibrated source rock model can then be used in Trinity to predict more detailed spatial variations.
Unconventional Resources
Using Kinex, you can plot the retained oil and gas volumes (mmbl/km2, bcf/km2), GOR of retained fluids as a function of maturity (vitrinite reflectance). This allows you to map sweet spots/zones in an unconventional play. If you use the ARCO expulsion model, you can take into account the saturation of oil and gas in kerogen porosity as well as silty inter granular porosity. You may find some of the concepts here . A detailed example based on the Eagle Ford shale is presented here .
Risk of Oil Cracking in Reservoirs
You can also quickly evaluate the risk of oil cracking to gas in a potential reseroivr you are prospecting.
The details and a couple of examples are presented here .
Calibrate Source Rock Kinetics with Natural Data
In the past, most kinetic models are developed by fitting laboratory high temperature pyrolysis yield curves. These models are suspicious because (a) due to the drastically different TP conditions, the reaction and hydrocarbon products from lab are different from petroleum fluids in nature, and (b) the uncertainty introduced by calibration of kinetic parameters at lab heating rates, typically degrees per minute, and then extrapolating 11 orders of magnitudes to degrees per million years in typical basins. Due to the increased drilling depths, and especially the boom in unconventional plays in recent years, more and more source rock data are available though the entire maturity range. Confidence in our kinetic models can be increased by matching the modeled reaction yield curve to naturally matured profiles.
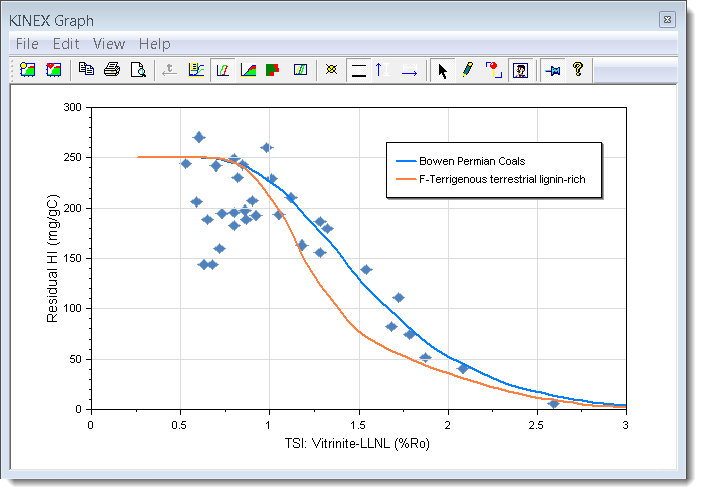
The figure below shows a Kinex plot of calculated HI vs VR, and the background is an image of a plot of coals from the Bowen basin at different maturity. The orange curve is the kinetics of the default F facies, while the blue curve is the adjusted model, with a slightly wider distribution of activation energies, to honor the data better.
Build/Test "Custom" Kinetics
Sometimes you may have some kinetic parameters measured off of source rock samples in the area. You can create a new kerogen kinetic model (organo-facies) in Kinex. For the following reasons we are not convinced that using such custom kinetic models add much value:
- The kinetic data may only be "bulk" kinetics determined from total pyrolysis yield. There is no separation of oil and gas. It is only useful for calculating total HC yield or maturity (transformation ratio), the model would not be able to predict fluid type (oil vs gas), GOR, or fluid properties (API).
- The argument for using these measured kinetics is that they may represent the source rock at question better than the standard organo-facies. This may not be a good argument sometimes in that the samples may not be as representative of the source facies in the kitchen area than one of the standard ones.
- The standard organo-facies have been tested and adjusted to match natural data sets and are less susceptible to extrapolation errors compared to the lab kinetics. Some published lab kinetics we have tested have given very geologically unrealistic predictions. Some give unnatural flat steps in generation curves, and some give temperatures way outside of observed natural ranges. We suspect insufficient data or numerical instability with the methods used.
- The standard organo-facies are averages of many data sets. They are a valid statistically norm which may be more predictive in an uncertain environment than a single data point even if this data point may have more relevance.
- The standard organo-facies also are calibrated to have the proper fluid properties, and GOR ranges while the so called custom kinetics is not
- Display the transformation ration curve of the custom kinetics and compare with one of the standard organo-facies. If there is less difference than the typical error bars - simply use the standard kinetics.
- If appreciable differences exists, you may adjust the activation energy of the standard organo-facies slightly to match the curve. If you carefully increase or decrease the activation energies of the oil and gas generation reaction by the same amount (number of kJ, it will maintain the GOR calibration of the standard organo-facies as well as other fluid properties that are tied to GOR.
References
- Pepper, A. S., 1991, Estimating the petroleum expulsion behavior of source rocks: a novel quantitative approach: in W. A. England, and A. J. Fleet, ed., Petroleum migration: The Geological Society Special Publication 59: London, p.9-31.
- Pepper, A. S., and P. J. Corvi, 1995, Simple kinetic models of petroleum formation. Part I: oil and gas generation from kerogen : Marine and Petroleum Geology, v. 12, p.291-319.
- Pepper, A. S., and T. A. Dodd, 1995, Simple kinetic models of petroleum formation. Part II: oil-gas cracking : Marine and Petroleum Geology, v. 12, p.321-340.
- Pepper, A. S., and P. J. Corvi, 1995, Simple kinetic models of petroleum formation. Part III: Modeling an open system : Marine and Petroleum Geology, v. 12, p.417-452.
©2003-2014, ZetaWare, Inc. All rights reserved