| Trinity Feature Examples |
| | Brochure ... | Movies ... | Compatibility ... | Products ... | Trinity Home ... | |
We made 3D visualization easy. The 3D view requires no expensive hardware. Map and fault surfaces as well as scattered well data can be shown/hidden with the click of a check box, Properties or seismic attributes can be draped on the surfaces. Of course all your cross sections (see next).
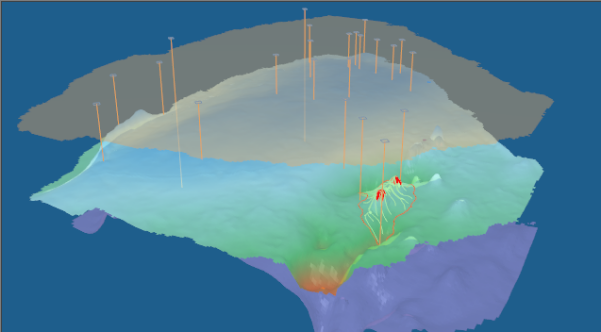
All components of the petroleum system can be viewed in 3D. Arbitrary cross sections may be combined with other data or results for analysis. The cross sections will move with you as you drag them around on the map.
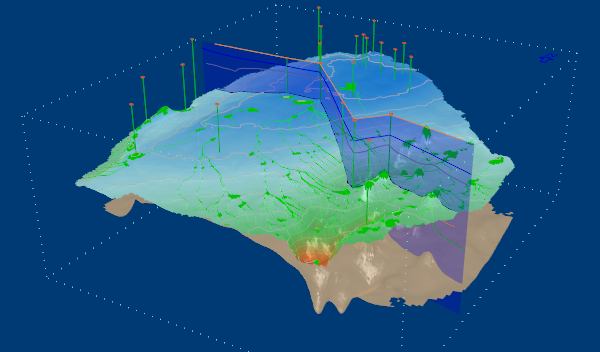
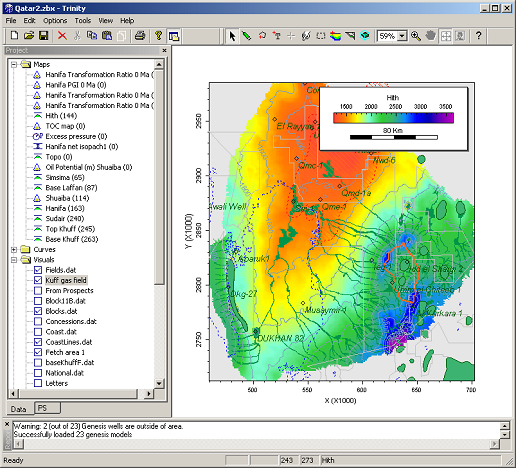
Here is another example that shows the relation between recent depocenters and the mature kitchen areas.
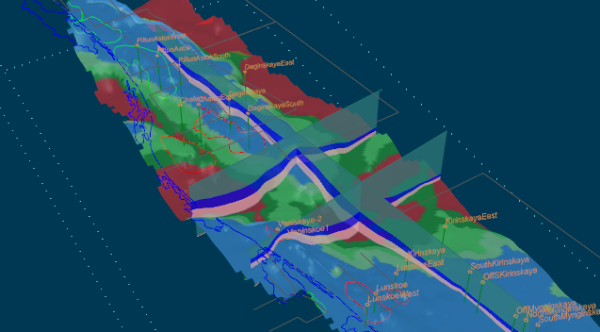
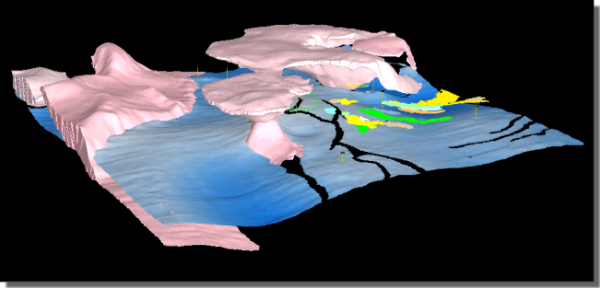
This example shows maturity overlay on the source structure map and some regional cross sections.
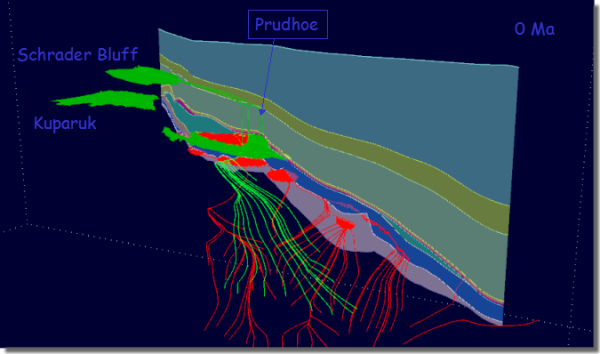
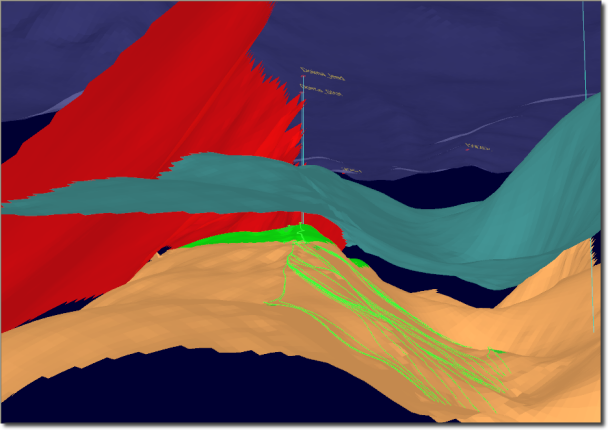
Migration History of North Slope Fields
Kuparuk field in Alaska was charged about 38 million years ago from the Shublik source rock and a deeper coal gas source. The fluids needed to migrate to the sub-crop to the north of the field and then migration back south along the LCU unconformity. (Dzou et. al. 2004). Later, the southern source rock area was uplifted and basin was tilted to the north, preventing further charge to the fields.
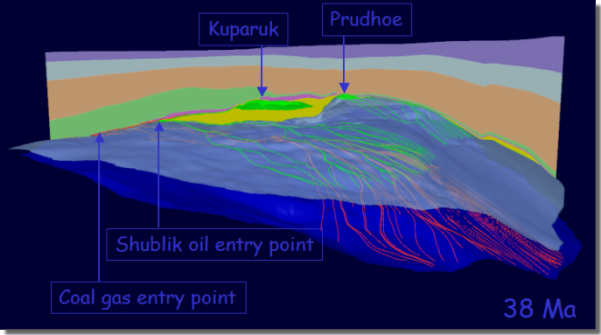
Later burial to the east resulted in HRZ oil to expel and migrate along a narrow subcropped area, mixing with Shublik source oil coming into the subcrop to fill the Prudhoe Bay field and leak through to fill Schrader Bluff (West Sak). Oil migration fairway charging Prudhoe field is limited by sub-crop juxtaposition. Kek coal gas (red lines) migrated along deeper formation and leaked into the Prudhoe from below.
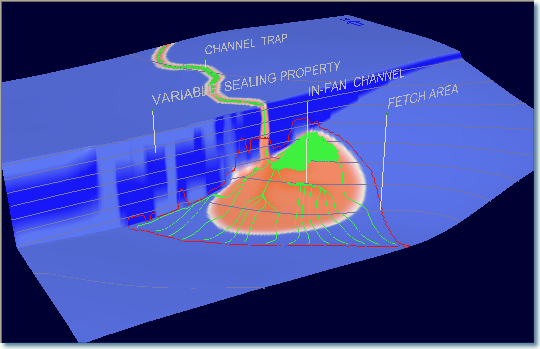
Fetch areas/cells can be calculated on the fly to show potential favarable areas of migration. Sweet spots and charge volumes for each cells can be added automatically.
Written by geologist for geologist
The simple, intuitive, interactive nature makes geological model building and analysis fast and easy. Modern metaphors allow user to input and manipulate data as graphical objects (e.g. drawing data points with a pencil, finding migration paths with a petroleum syringe.). Professional quality graphics directly go into your Word document or PowerPoint presentations.
Trinity is compatible with all major data interpretation and mapping software used in the industry. ZMap, Petrosys, CPS3, ArcView, IRAP, OpenWorks, EarthVisioin, Surfer, GoCAD, GeoMap and other geological software packages . In fact, compatible is a understatement. To import any file, all you have to do is to drag the file and drop it in Trinity. That's it. It automatically recognizes all the data formats , so user does not have to even to pick from the menu.
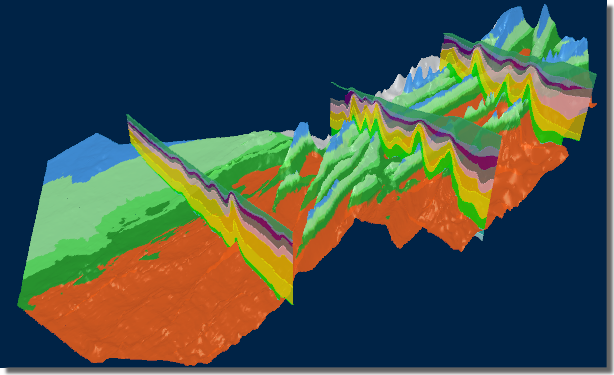
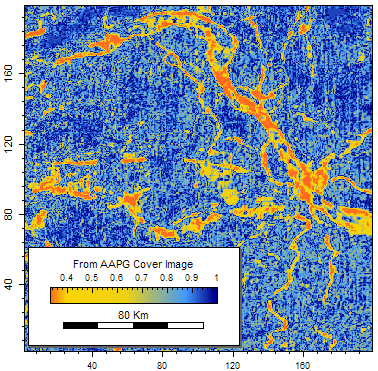
In addition to its compete list of supported digital data formats, user can even import a scanned image or a copied picture from some else's PowerPoint presentation, the geo-reference it and convert it to digital data. The following facies data is imported from a scanned image from the cover of AAPG for use as facies control in migration modeling.
3D closed shapes can be imported from GoCAD.
Capillary properties along faults can be varied in map view to predict column heights for a given structure geometry and fault seal. This image is a direct screen capture. The annotations are created in Trinity as well.
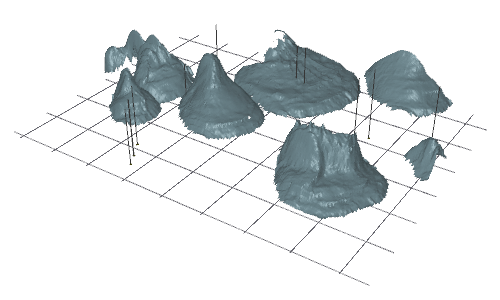
Fault grids can be used directly or fault surfaces can be imported from GoCAD to the 3D viewer.
This picture is also a direct screen shot. If you guessed what these objects represent, email us with the answer. You can win a ZetaWare hat!
Copyright ©2001-2004, ZetaWare, Inc. All rights reserved